


States’ Economic Recovery From COVID-19 Pandemic Is Widely Varied
Posted by Warm Southern Breeze on Monday, November 14, 2022
The good people at GoBankingRates.com have compiled a short list of “States Whose Economies Are Failing vs. States Whose Economies Are Thriving,” which was written by Certified Financial Planner and Registered Investment Adviser John Csiszar, who, following his graduation from UCLA with a B.A. in English and a specialization in Business, worked in the financial services industry for 18 years.
Mr. Csiszar also earned the Certified Life Underwriter designation, while simultaneously working for a major, full-service Wall Street broker-dealer, and forming his own investment advisory firm, which managed over $100 million in client assets, in addition to providing investment advisory services, financial planning, and other related services.
His financial specialties include performing financial analysis, risk-avoidance strategies, long-term savings techniques, capital preservation tips, personalized investment advice, and daily budgeting.
In addition to that stellar financial profile, he further demonstrated diverse entrepreneurial skills by opening and managing a boutique travel company, and is a published author of 5 educational books on topics ranging from information technology to the element aluminum which are aimed toward the young adult market. He has also written extensively for numerous renown publications, and has authored several thousands of articles on personal financial planning, and financial services. 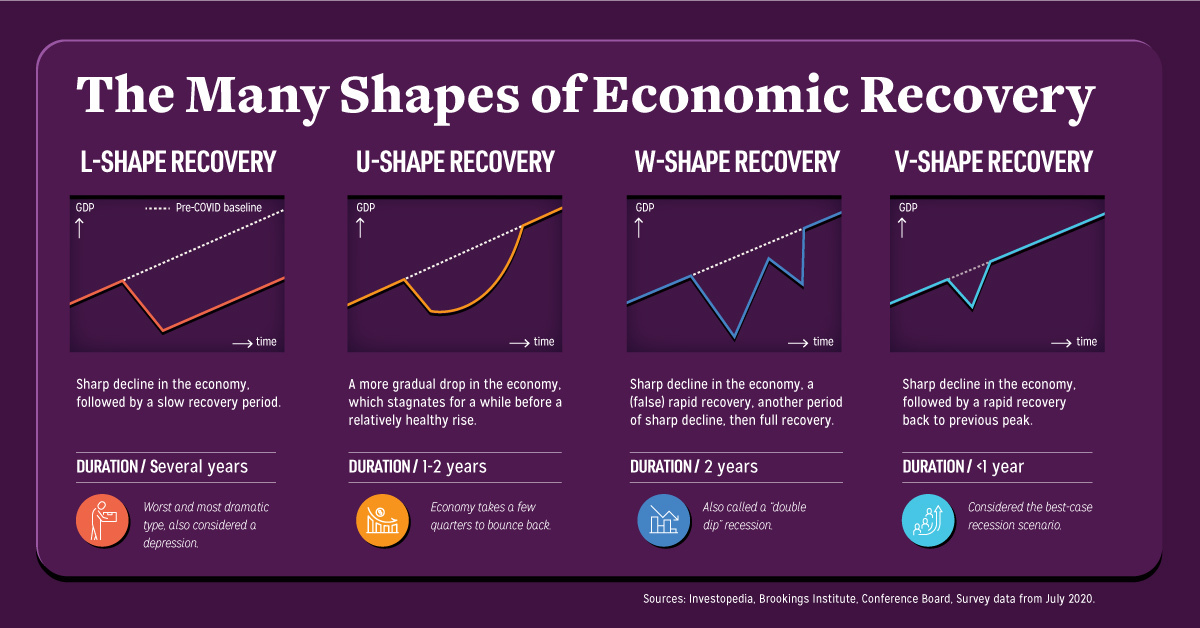
In his most recent article for GoBankingRates.com, “States Whose Economies Are Failing vs. States Whose Economies Are Thriving,” he lists 15 states each in 2 categories: States Whose Economies Are Failing, and States Whose Economies Are Thriving. The general purpose of the article and enumeration is to examine how states are faring in their economic recovery from the COVID-19 pandemic. By examining 60% of the 50 states, it provides a relatively decent picture of the overall state of the states, and how they are each faring as individual parts of the greater national economy.
He notes specifically that because “the U.S. is such a large country, with a wide diversity of states and economies, the recovery is not what you’d call consistent. Some states have already made a rebound almost all the way back to pre-pandemic levels, while others have continued to struggle to return to a state of balance.”
The metrics he examines for all states are:
1.) March 2022 unemployment rate;
2.) Year-over-year change in unemployment Feb. 2021;
3.) Q4 2021 GDP per capita;
4.) GDP growth Q3 2021-Q4 2021;
5.) Average weekly wages Sept. 2020;
6.) Percent change in average weekly wages Sept. 2020-Sept. 2021, and;
7.) Percent of population below poverty line 2020.
While it should be unnecessary to mention, it is worth noting that, in order to compile such a list, ALL 50 states, and their corresponding metrics, must be examined, compared, and contrasted.
Without further ado, here are 15…
States Whose Economies Are Failing
1. Michigan
March 2022 unemployment rate: 4.4%
Year-over-year change in unemployment Feb. 2021: 4.2%
Q4 2021 GDP per capita: $43,580
GDP growth Q3 2021-Q4 2021: 5.8%
Average weekly wages Sept. 2020: $1,154
Percent change in average weekly wages Sept. 2020-Sept. 2021: 5.3%
Percent of population below poverty line 2020: 10.6%
2. South Carolina
March 2022 unemployment rate: 3.4%
Year-over-year change in unemployment Feb. 2021: 2.7%
Q4 2021 GDP per capita: $54,280
GDP growth Q3 2021-Q4 2021: 6.8%
Average weekly wages Sept. 2020: $988
Percent change in average weekly wages Sept. 2020-Sept. 2021: 6.9%
Percent of population below poverty line 2020: 14.2%
3. Arkansas
March 2022 unemployment rate: 3.1%
Year-over-year change in unemployment Feb. 2021: 2.8%
Q4 2021 GDP per capita: $49,732
GDP growth Q3 2021-Q4 2021: 5.1%
Average weekly wages Sept. 2020: $963
Percent change in average weekly wages Sept. 2020-Sept. 2021: 7.8%
Percent of population below poverty line 2020: 14.1%
4. North Dakota
March 2022 unemployment rate: 2.9%
Year-over-year change in unemployment Feb. 2021: 3.1%
Q4 2021 GDP per capita: $85,647
GDP growth Q3 2021-Q4 2021: -1.8%
Average weekly wages Sept. 2020: $1,076
Percent change in average weekly wages Sept. 2020-Sept. 2021: 5.1%
Percent of population below poverty line 2020: 9.4%
5. Kansas
March 2022 unemployment rate: 2.5%
Year-over-year change in unemployment Feb. 2021: 1.5%
Q4 2021 GDP per capita: $67,570
GDP growth Q3 2021-Q4 2021: 1.5%
Average weekly wages Sept. 2020: $997
Percent change in average weekly wages Sept. 2020-Sept. 2021: 4.7%
Percent of population below poverty line 2020: 9.3%
6. Alabama
March 2022 unemployment rate: 2.9%
Year-over-year change in unemployment Feb. 2021: 1.58%
Q4 2021 GDP per capita: $51,086
GDP growth Q3 2021-Q4 2021: 5.7%
Average weekly wages Sept. 2020: $1,030
Percent change in average weekly wages Sept. 2020-Sept. 2021: 5.3%
Percent of population below poverty line 2020: 13.9%
7. Ohio
March 2022 unemployment rate: 4.1%
Year-over-year change in unemployment Feb. 2021: 2.1%
Q4 2021 GDP per capita: $64,941
GDP growth Q3 2021-Q4 2021: 5.5%
Average weekly wages Sept. 2020: $1,098
Percent change in average weekly wages Sept. 2020-Sept. 2021: 5.6%
Percent of population below poverty line 2020: 12.5%
8. New Mexico
March 2022 unemployment rate: 5.3%
Year-over-year change in unemployment Feb. 2021: 5.9%
Q4 2021 GDP per capita: $54,200
GDP growth Q3 2021-Q4 2021: 7.6%
Average weekly wages Sept. 2020: $997
Percent change in average weekly wages Sept. 2020-Sept. 2021: 5.6%
Percent of population below poverty line 2020: 15.9%
9. South Dakota
March 2022 unemployment rate: 2.5%
Year-over-year change in unemployment Feb. 2021: 2.1%
Q4 2021 GDP per capita: $70,148
GDP growth Q3 2021-Q4 2021: 0.3%
Average weekly wages Sept. 2020: $965
Percent change in average weekly wages Sept. 2020-Sept. 2021: 5.1%
Percent of population below poverty line 2020: 11.1%
10. Kentucky
March 2022 unemployment rate: 4%
Year-over-year change in unemployment Feb. 2021: 2.5%
Q4 2021 GDP per capita: $54,216
GDP growth Q3 2021-Q4 2021: 5.9%
Average weekly wages Sept. 2020: $989
Percent change in average weekly wages Sept. 2020-Sept. 2021: 5.8%
Percent of population below poverty line 2020: 13.8%
11. Iowa
March 2022 unemployment rate: 3.3%
Year-over-year change in unemployment Feb. 2021: 2.1%
Q4 2021 GDP per capita: $70,683
GDP growth Q3 2021-Q4 2021: -2.3%
Average weekly wages Sept. 2020: $1,015
Percent change in average weekly wages Sept. 2020-Sept. 2021: 4.9%
Percent of population below poverty line 2020: 9.3%
12. Louisiana
March 2022 unemployment rate: 4.2%
Year-over-year change in unemployment Feb. 2021: 2.5%
Q4 2021 GDP per capita: $57,769
GDP growth Q3 2021-Q4 2021: 5.7%
Average weekly wages Sept. 2020: $1,021
Percent change in average weekly wages Sept. 2020-Sept. 2021: 5.4%
Percent of population below poverty line 2020: 16.7%
13. Alaska
March 2022 unemployment rate: 5%
Year-over-year change in unemployment Feb. 2021: 1.6%
Q4 2021 GDP per capita: $79,139
GDP growth Q3 2021-Q4 2021: 3%
Average weekly wages Sept. 2020: $1,205
Percent change in average weekly wages Sept. 2020-Sept. 2021: 3.4%
Percent of population below poverty line 2020: 11.8%
14. West Virginia
March 2022 unemployment rate: 3.7%
Year-over-year change in unemployment Feb. 2021: 1.7%
Q4 2021 GDP per capita: $51,573
GDP growth Q3 2021-Q4 2021: 1.7%
Average weekly wages Sept. 2020: $960
Percent change in average weekly wages Sept. 2020-Sept. 2021: 5%
Percent of population below poverty line 2020: 14%
15. Mississippi
March 2022 unemployment rate: 4.2%
Year-over-year change in unemployment Feb. 2021: 2.5%
Q4 2021 GDP per capita: $57,769
GDP growth Q3 2021-Q4 2021: 5.7%
Average weekly wages Sept. 2020: $1,021
Percent change in average weekly wages Sept. 2020-Sept. 2021: 5.4%
Percent of population below poverty line 2020: 16.7%
Here also are 15…
States Whose Economies Are Thriving
1. New Hampshire
March 2022 unemployment rate: 2.5%
Year-over-year change in unemployment Feb. 2021: 3.8%
Q4 2021 GDP per capita: $73,751
GDP growth Q3 2021-Q4 2021: 7.9%
Average weekly wages Sept. 2020: $1,349
Percent change in average weekly wages Sept. 2020-Sept. 2021: 15%
Percent of population below poverty line 2020: 4.9%
2. Massachusetts
March 2022 unemployment rate: 4.3%
Year-over-year change in unemployment Feb. 2021: 5.4%
Q4 2021 GDP per capita: $95,029
GDP growth Q3 2021-Q4 2021: 7.8%
Average weekly wages Sept. 2020: $1,593
Percent change in average weekly wages Sept. 2020-Sept. 2021: 7%
Percent of population below poverty line 2020: 8%
3. Washington
March 2022 unemployment rate: 4.2%
Year-over-year change in unemployment Feb. 2021: 5.1%
Q4 2021 GDP per capita: $90,034
GDP growth Q3 2021-Q4 2021: 8.3%
Average weekly wages Sept. 2020: $1,578
Percent change in average weekly wages Sept. 2020-Sept. 2021: 6.6%
Percent of population below poverty line 2020: 7.6%
4. California
March 2022 unemployment rate: 4.9%
Year-over-year change in unemployment Feb. 2021: 6.4%
Q4 2021 GDP per capita: $89,540
GDP growth Q3 2021-Q4 2021: 9.5%
Average weekly wages Sept. 2020: $1,576
Percent change in average weekly wages Sept. 2020-Sept. 2021: 7.7%
Percent of population below poverty line 2020: 10.6%
5. Oregon
March 2022 unemployment rate: 3.8%
Year-over-year change in unemployment Feb. 2021: 4.5%
Q4 2021 GDP per capita: $65,806
GDP growth Q3 2021-Q4 2021: 9.8%
Average weekly wages Sept. 2020: $1,220
Percent change in average weekly wages Sept. 2020-Sept. 2021: 9.6%
Percent of population below poverty line 2020: 8.8%
6. Utah
March 2022 unemployment rate: 2%
Year-over-year change in unemployment Feb. 2021: 3.8%
Q4 2021 GDP per capita: $69,007
GDP growth Q3 2021-Q4 2021: 6.5%
Average weekly wages Sept. 2020: $1,087
Percent change in average weekly wages Sept. 2020-Sept. 2021: 7.1%
Percent of population below poverty line 2020: 7.4%
7. Nevada
March 2022 unemployment rate: 5%
Year-over-year change in unemployment Feb. 2021: 9.1%
Q4 2021 GDP per capita: $64,983
GDP growth Q3 2021-Q4 2021: 7.9%
Average weekly wages Sept. 2020: $1,135
Percent change in average weekly wages Sept. 2020-Sept. 2021: 8.3%
Percent of population below poverty line 2020: 11.7%
8. New Jersey
March 2022 unemployment rate: 4.2%
Year-over-year change in unemployment Feb. 2021: 5.5%
Q4 2021 GDP per capita: $75,549
GDP growth Q3 2021-Q4 2021: 7.4%
Average weekly wages Sept. 2020: $1,384
Percent change in average weekly wages Sept. 2020-Sept. 2021: 4.1%
Percent of population below poverty line 2020: 7.2%
9. District of Columbia
March 2022 unemployment rate: 6%
Year-over-year change in unemployment Feb. 2021:4.8%
Q4 2021 GDP per capita: $233,500
GDP growth Q3 2021-Q4 2021: 3.5%
Average weekly wages Sept. 2020: $2,042
Percent change in average weekly wages Sept. 2020-Sept. 2021: 4.1%
Percent of population below poverty line 2020: 14.6%
10. Florida
March 2022 unemployment rate: 3.2%
Year-over-year change in unemployment Feb. 2021: 5.7%
Q4 2021 GDP per capita: $59,046
GDP growth Q3 2021-Q4 2021: 7.5%
Average weekly wages Sept. 2020: $1,120
Percent change in average weekly wages Sept. 2020-Sept. 2021: 8.7%
Percent of population below poverty line 2020: 12.4%
11. Colorado
March 2022 unemployment rate: 3.7%
Year-over-year change in unemployment Feb. 2021: 4.9%
Q4 2021 GDP per capita: $75,860
GDP growth Q3 2021-Q4 2021: 6%
Average weekly wages Sept. 2020: $1,322
Percent change in average weekly wages Sept. 2020-Sept. 2021: 7%
Percent of population below poverty line 2020: 9.4%
12. Tennessee
March 2022 unemployment rate: 3.2%
Year-over-year change in unemployment Feb. 2021: 4.1%
Q4 2021 GDP per capita: $62,944
GDP growth Q3 2021-Q4 2021: 9.9%
Average weekly wages Sept. 2020: $1,111
Percent change in average weekly wages Sept. 2020-Sept. 2021: 8.7%
Percent of population below poverty line 2020: 7%
13. Idaho
March 2022 unemployment rate: 2.7%
Year-over-year change in unemployment Feb. 2021: 3.2%
Q4 2021 GDP per capita: $51,793
GDP growth Q3 2021-Q4 2021: 8.2%
Average weekly wages Sept. 2020: $953
Percent change in average weekly wages Sept. 2020-Sept. 2021: 7.8%
Percent of population below poverty line 2020: 8.1%
14. Texas
March 2022 unemployment rate: 4.4%
Year-over-year change in unemployment Feb. 2021: 5.9%
Q4 2021 GDP per capita: $71,274
GDP growth Q3 2021-Q4 2021: 10.1%
Average weekly wages Sept. 2020: $1,2427
Percent change in average weekly wages Sept. 2020-Sept. 2021: 6.7%
Percent of population below poverty line 2020: 12.5%
15. Minnesota
March 2022 unemployment rate: 2.5%
Year-over-year change in unemployment Feb. 2021: 2.3%
Q4 2021 GDP per capita: $75,234
GDP growth Q3 2021-Q4 2021: 5%
Average weekly wages Sept. 2020: $1,249
Percent change in average weekly wages Sept. 2020-Sept. 2021: 6.1%
Percent of population below poverty line 2020: 7%

Leave a comment